ANCOVA
ANCOVA stands for Analysis of Covariance. It is a statistical technique that combines the principles of analysis of variance (ANOVA) with regression.
ANCOVA is used to compare group means while statistically controlling for the effects of other continuous variables that are not of primary interest, referred to as covariates.
To analyse it in BioStat Prime user must follow the steps as given.
- Steps
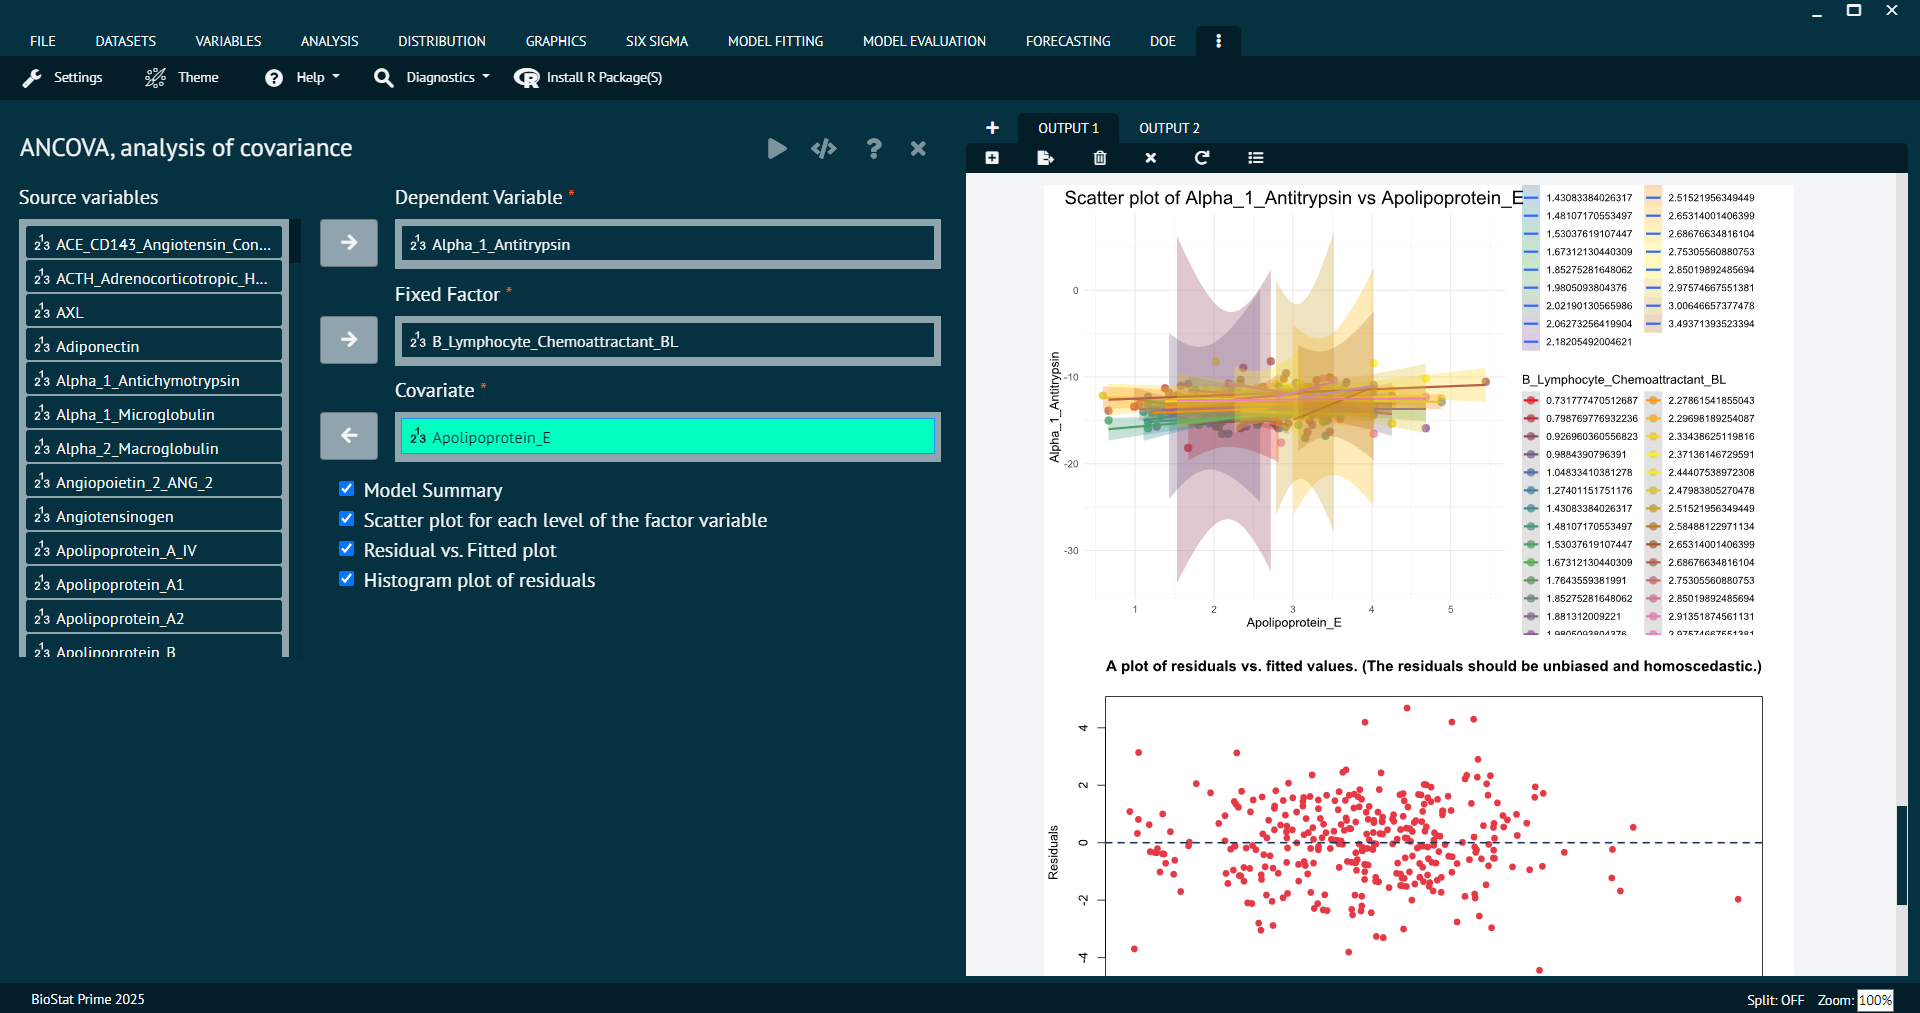
Load the dataset -> Click on the analysis tab in main menu -> Select means -> The means tab leads to the ANCOVA analysis technique in the dialog -> In the dialog select the variable and options according to the requirement -> Execute the dialog.

The output of the analysis is shown in the output window. The user can also opt for Model Summary, Scatter plot for each level of the factor variable, Residual vs. Fitted plot, Histogram plot of residuals visualise the output as a plot.

Analysis of covariance (ANCOVA) combines features of both ANOVA and regression. It augments the ANOVA model with one or more additional quantitative variables, called covariates, which are related to the response variable. The covariates are included to reduce the variance in the error terms and provide more precise measurement of the treatment effects.


BioStat Prime first generate an Anova table with the interaction term. The goal is to examine whether the interaction term is not significant i.e. the slopes of the dependent variable against the covariate for each level of the fixed factor is not different. BioStat Prime uses the Anova package in the car package to generate this Anova table.
BioStat Prime then regenerate the Anova table controlling for the interaction term to determine whether the intercepts of the dependent variable against the covariate for each level of the fixed factor are different.
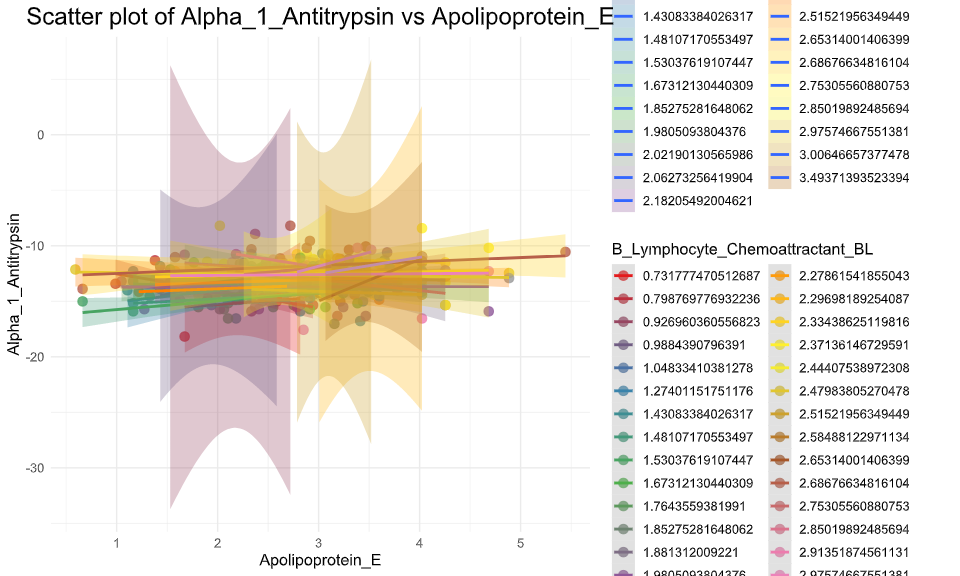
BioStat Prime provides the option to generating a scatter plot for of dependent variable against the covariate variable for each level of the fixed factor.
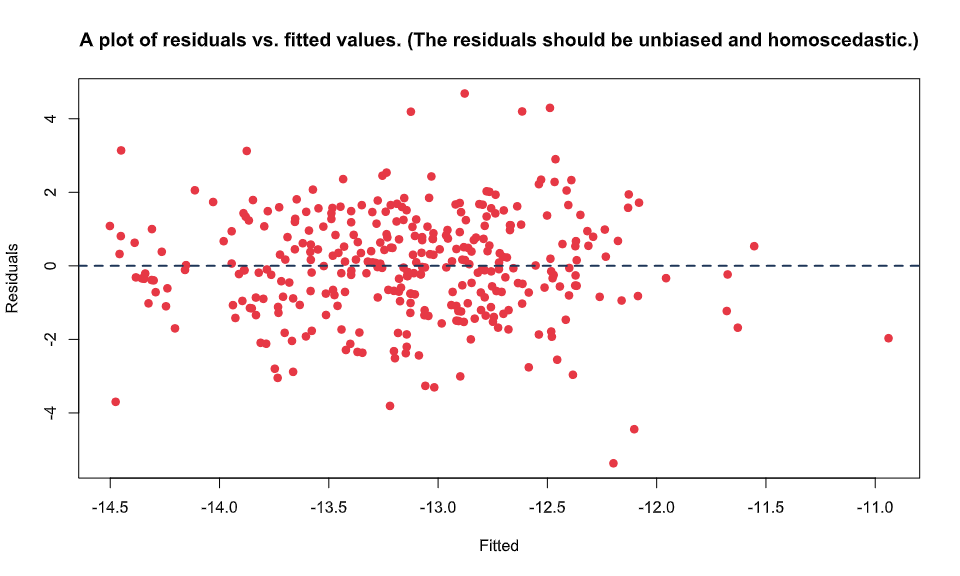
BioStat Prime provides the option to plot the residuals vs. fitted plot For the model where we have controlled the interaction term. The residuals should be unbiased and homoscedastic.
BioStat Prime provides the option to generate a histogram for the residuals for model where we have controlled the interaction term. (Distribution should be approx normal).
BioStat Prime gives user the option to summarize the model
Arguments
- formula
an object of class "formula" (or one that can be coerced to that class): a symbolic description of the model to be fitted. The details of model specification are given under ‘Details’.
- data
an optional data frame, list or environment (or object coercible by as.data.frame to a data frame) containing the variables in the model. If not found in data, the variables are taken from environment(formula), typically the environment from which lm is called.