Chi-square test
The chi-square test, also known as the χ² test (chi-squared test), is a statistical test used to determine if there is a significant association or independence between two categorical variables in a contingency table.
Chi-square statistic is calculated from the contingency table to assess the extent of the association. It measures the difference between the observed frequencies (counts) and the expected frequencies (counts) under the assumption of independence.
The formula for calculating the chi-square statistic depends on the table's dimensions but generally involves comparing each observed frequency to its expected value and summing up these differences.
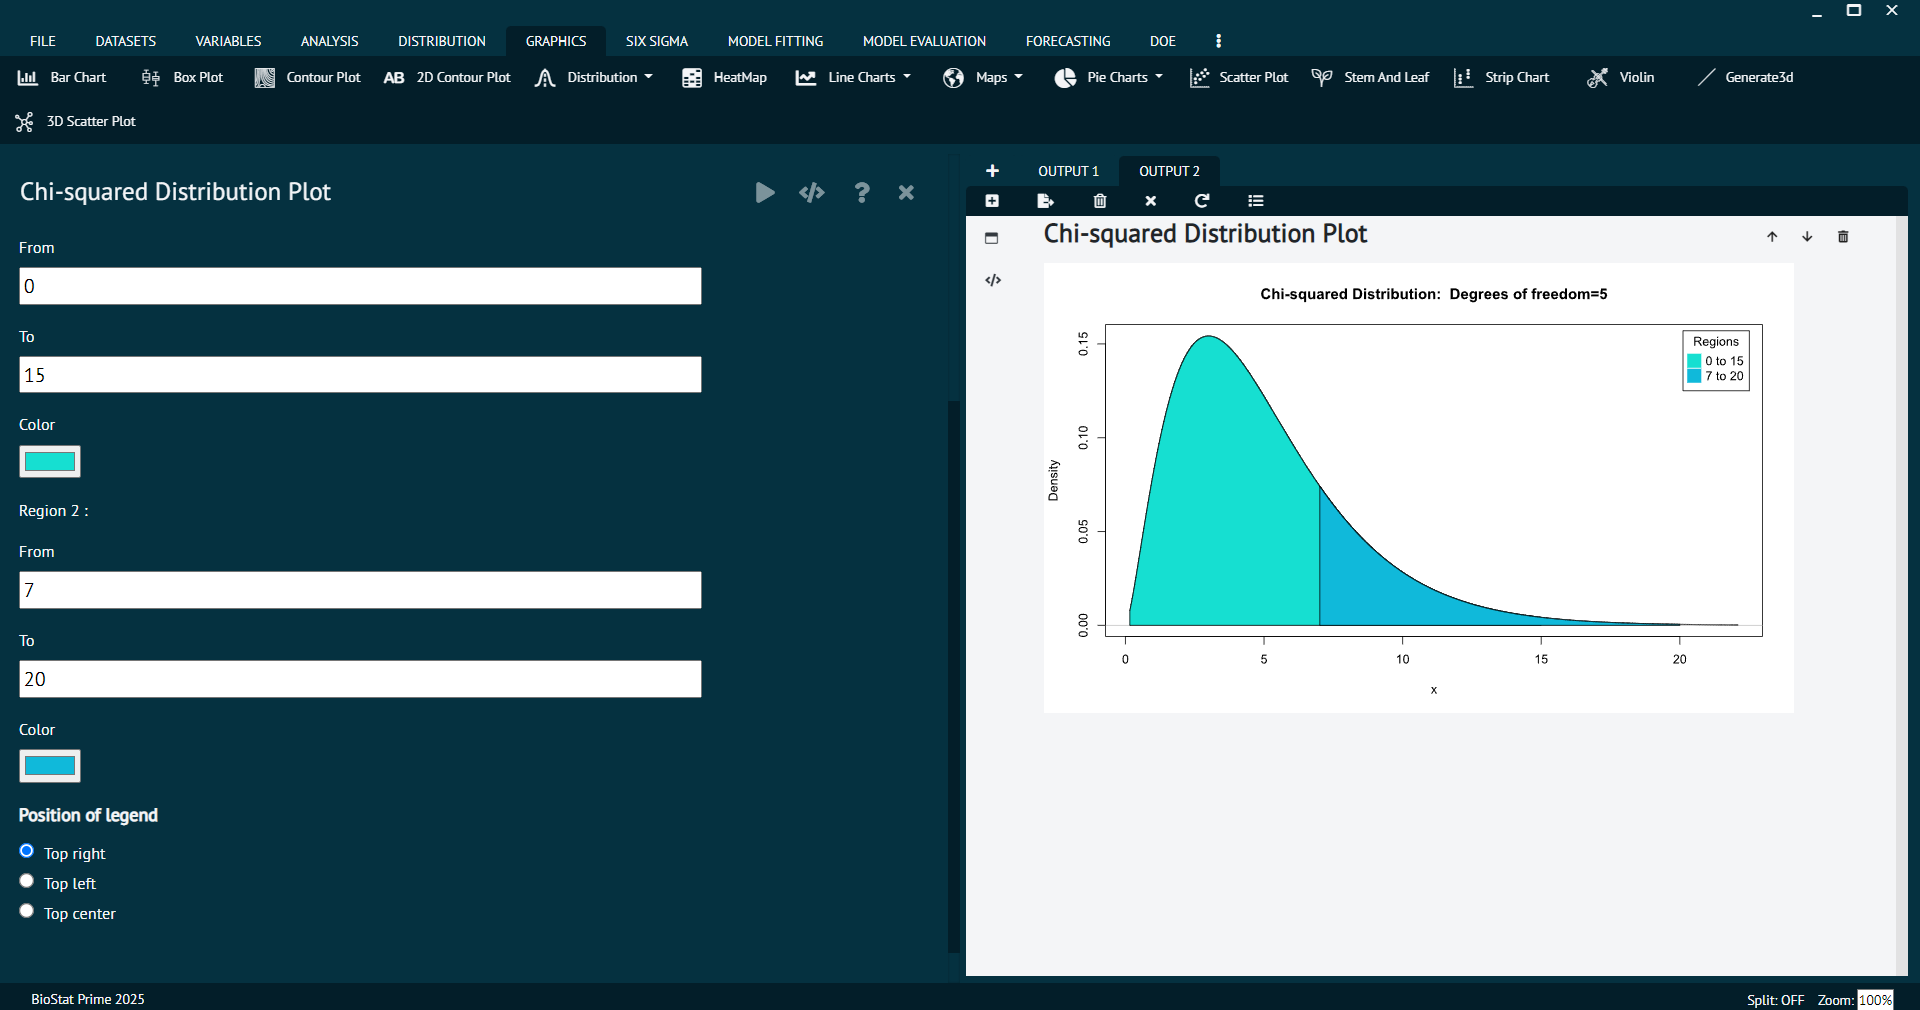
Chi-square Distribution plot
Density, distribution function, quantile function and random generation for the chi-squared (chi^2) distribution with df degrees of freedom and optional non-centrality parameter ncp.
To analyse it in BioStat user must follow the steps as given.
- Steps
Load the dataset -> Click on the Distribution tab in main menu -> Select Chi square test -> This leads to analysis technique Chi-square Distribution plot in the dialog -> In the dialog window select the options according to the requirements then execute -> The output will be represented in output window.

Usage
Value
dchisq gives the density, pchisq gives the distribution function, qchisq gives the quantile function, and rchisq generates random deviates. Invalid arguments will result in return value NaN, with a warning.
The length of the result is determined by n for rchisq, and is the maximum of the lengths of the numerical arguments for the other functions. The numerical arguments other than n are recycled to the length of the result. Only the first elements of the logical arguments are used.
Chi-square Probabilities
To analyse it in BioStat user must follow the steps as given.
- Steps
Load the dataset -> Click on the Distribution tab in main menu -> Select Chi square test -> This leads to analysis technique Chi-square Probabilities in the dialog -> In the dialog window select the options according to the requirements then execute -> The output will be represented in output window.

Usage
Value
dchisq gives the density, pchisq gives the distribution function, qchisq gives the quantile function, and rchisq generates random deviates. Invalid arguments will result in return value NaN, with a warning.
The length of the result is determined by n for rchisq, and is the maximum of the lengths of the numerical arguments for the other functions. The numerical arguments other than n are recycled to the length of the result. Only the first elements of the logical arguments are used.
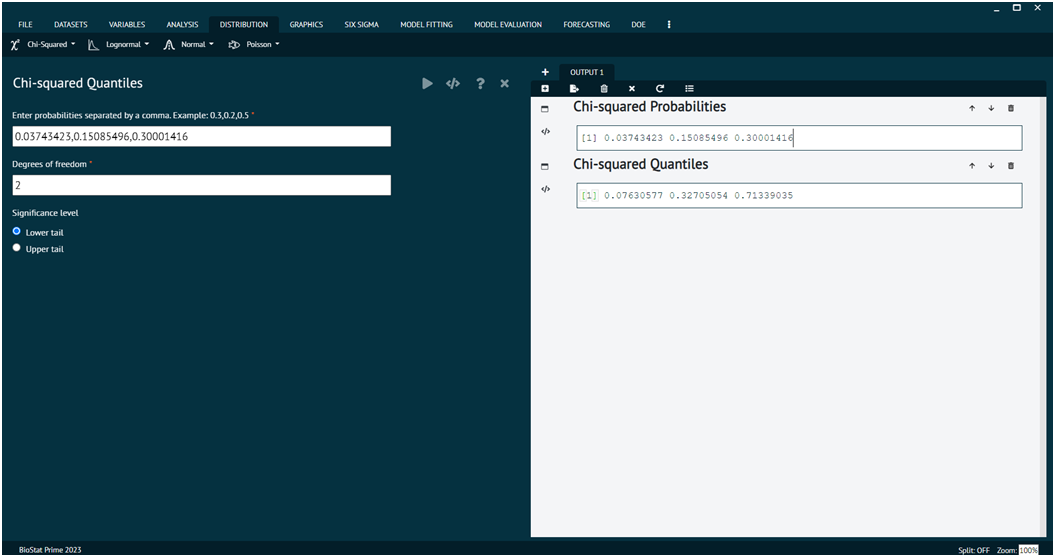
Chi-square Quantiles
To analyse it in BioStat user must follow the steps as given.
- Steps
Load the dataset -> Click on the Distribution tab in main menu -> Select Chi square test -> This leads to analysis technique Chi-square Quantiles in the dialog -> In the dialog window select the options according to the requirements then execute -> The output will be represented in output window.

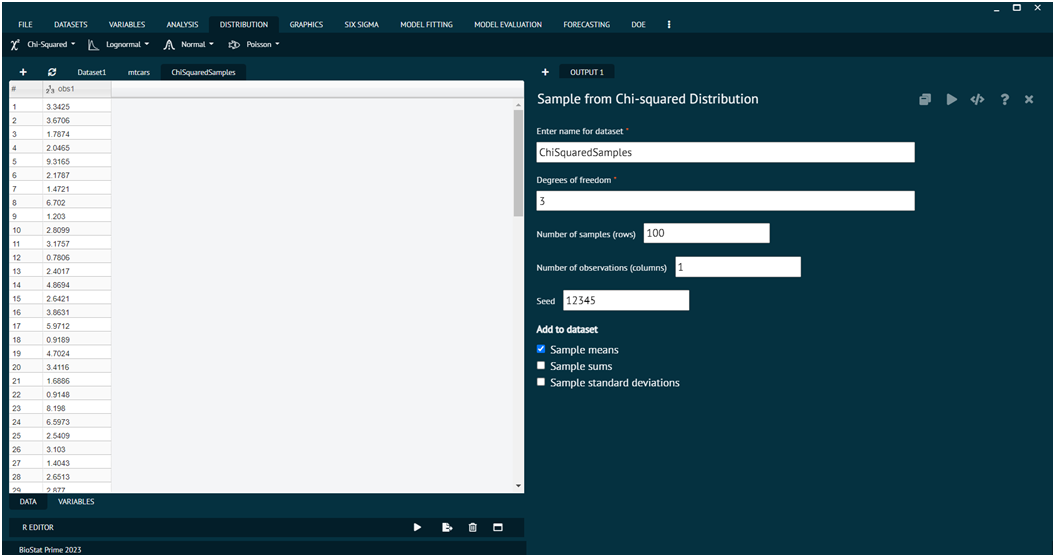
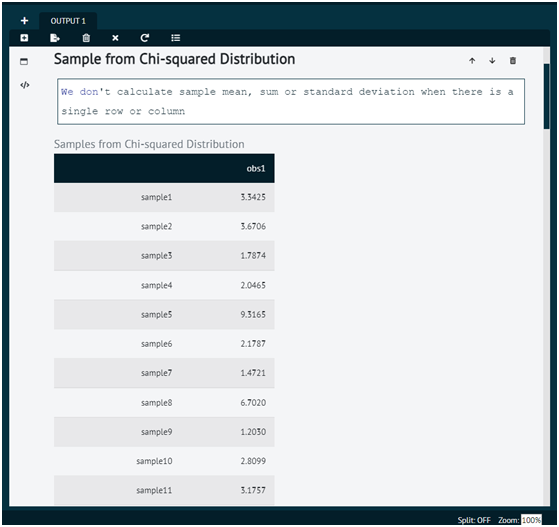
Sample from Chi-square Distribution
To analyse it in BioStat user must follow the steps as given.
- Steps
Load the dataset -> Click on the Distribution tab in main menu -> Select Chi square test -> this leads to analysis technique Sample from Chi-square Distribution in the dialog -> In the dialog window select the options according to the requirements then execute -> The output will be represented in output window.

