Linear Regression, Advanced
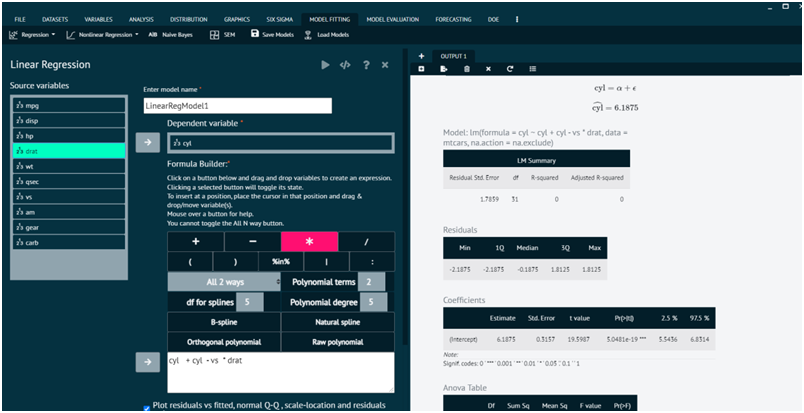
Builds a linear regression model by creating a formula using the formula builder. Internally calls function lm in stats package. Returns an object called BSkyLinearRegression which is an object of class lm.
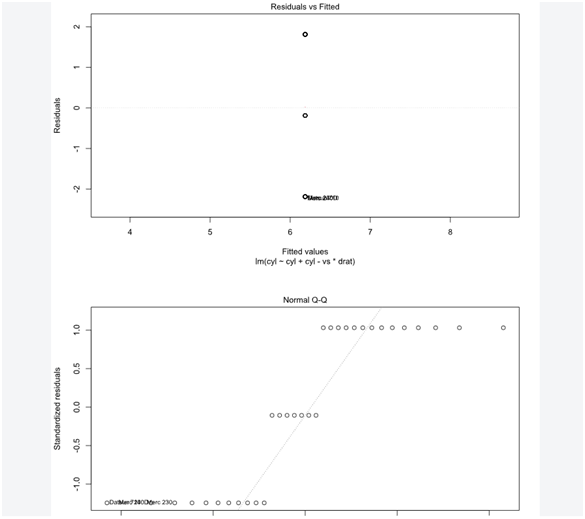
Displays a summary of the model, coefficient table, Anova table and sum of squares table and plots the following residuals vs. fitted, normal Q-Q, theoretical quantiles, residuals vs. leverage.
To analyse it in BioStat Prime user must follow the steps as given.
- Steps
Load the dataset -> Click on the Model Fitting tab in main menu -> Select Regression -> This leads to analysis techniques, choose Linear, Advanced -> There will appear a dialog -> Select the model name, dependent variables and populate a formula in the dialog -> Check the radio button to display a plot in the output -> Finally execute the plot and visualise the output in output window.


Arguments
- depVar
Name of the dependent variable. If we have a dataset cars, with a variable mpg that we want to predict mpg (dependent variable is mpg) enter mpg
- indepVars
Names of the dependent variable. If we have a dataset cars, with dependent variable horsepower, enginesize, enter horsepower+enginesize. Categorical variables are automatically dummy coded.
- dataset
Name of the dataframe. When you open data frames or datasets e.g. csv, Excel files, SAS files in BioStat Prime, they are named Dataset1, Dataset2, Dataset3 so enter Dataset1