Summary
Descriptive Statistics
Descriptive statistics are used to summarize and describe a dataset, providing a clear and concise overview of its main characteristics. There are several types of descriptive statistics commonly used, includingMeasures of central tendency are statistical measures that describe the centre or typical value of a dataset. They provide insight into where the "average" or "middle" of the data lies.
To analyse it in BioStat Prime user must follow the steps as given.
- Steps
Load the dataset -> Click on the analysis tab in main menu -> Select summary.
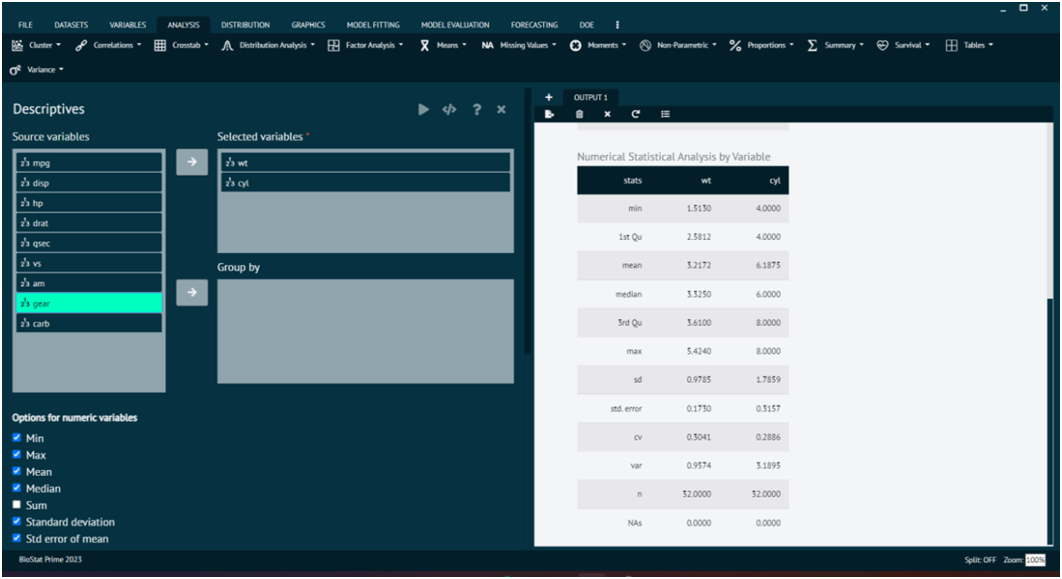
The summary tab contains an option namely descriptive that contains all the descriptive statistic analysis techniques. Once the descriptive techniques are chosen and variables are targeted then, user needs to execute the dialog to see the analysis in output window.

In Descriptive function of summary tab, user can opt for options like MIN, MAX, MEAN, MEDIAN, SUM, STANDARD DEVIATION, STD ERROR MEAN as per the requirement.
Furthermore, other functions can also be applied on the dataset like explore dataset, explore variables, frequencies.
- datasetColumnObjects
selected scale variables (say Dataset
var2) - groupByColumnObjects
one or more factor variables to group by (say Dataset
var4) - statFunctionList
List of functions. The ones set to TRUE will be executed. (say min=TRUE, sd=TRUE)
- quantilesProbs
Probabilities of the quantiles
- additionalStats
Addition statistical function that user can pass (say var)
- datasetName
Name of the dataset from which datasetColumnObjects and groupByColumnObjects are chosen
- long_table
Long table option is introduced to accommodate analysis done on a large number of variables. Choosing the long format controls the width of the output table making it easy to view results withing having to scroll right on the output window.
Explore Dataset
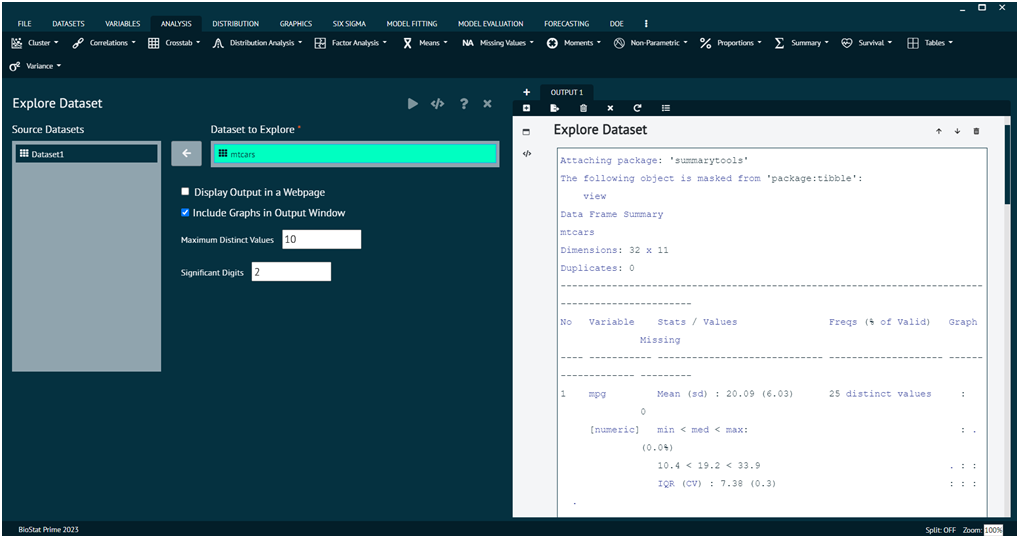
This section of summary tab gives user a chance to explore the dataset. The picture below shows the way user can opt for required dataset and explore it.
This creates a table describing a dataset. Descriptions include the dataset name, number of observations, number of variables, number of duplicate records, variable names, variable classes, variable summary statistics, and graphs.

- Dataset to Explore
Dataset that you want to describe
- Display Output in a Webpage
Check if you want to display a pretty version of the table in the default web browser. This version will have graphs included.
- Include Graphs in Output Window
Check if you want to include text versions of the graphs in the BioStat output window
- Maximum Distinct Values
The maximum number of values to display frequencies for. If a variable has more distinct values than this number, the remaining frequencies will be reported as a whole category, along with the number of additional distinct values. For character variables, the most frequent values are displayed, so this also controls how many to show in that case. The default is 10.
Explore Variables
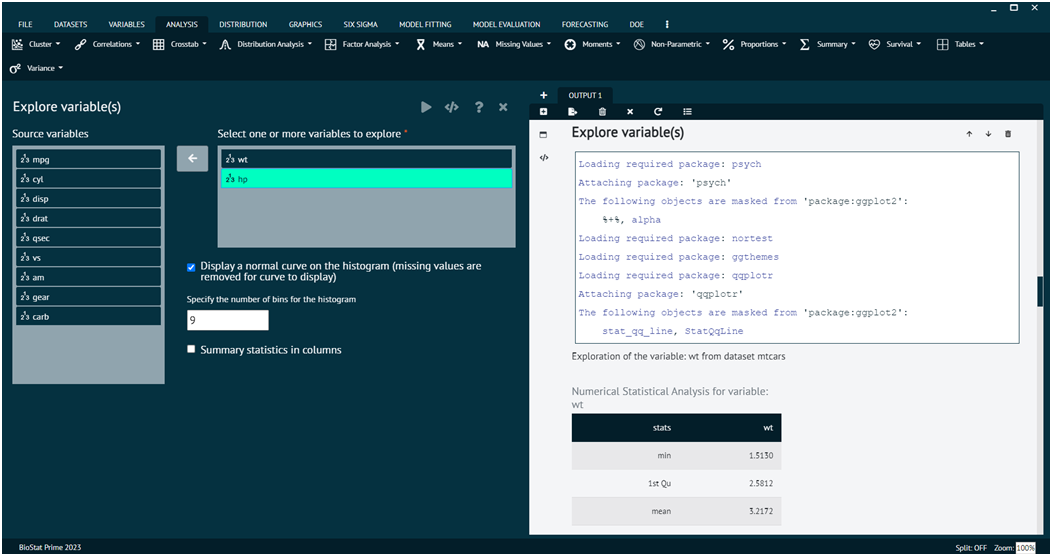
This section of summary tab gives user a chance to explore the variables of loaded dataset. The picture below shows the way user can choose required variables and execute the dialog to explore it.
Outputs the following descriptive statistics and plots: min, max, mean, median, modes, sum, sd, cv (coefficient of variance), var, stderror, skew, kurtosi, mad, iqr, and quartiles.

Frequency
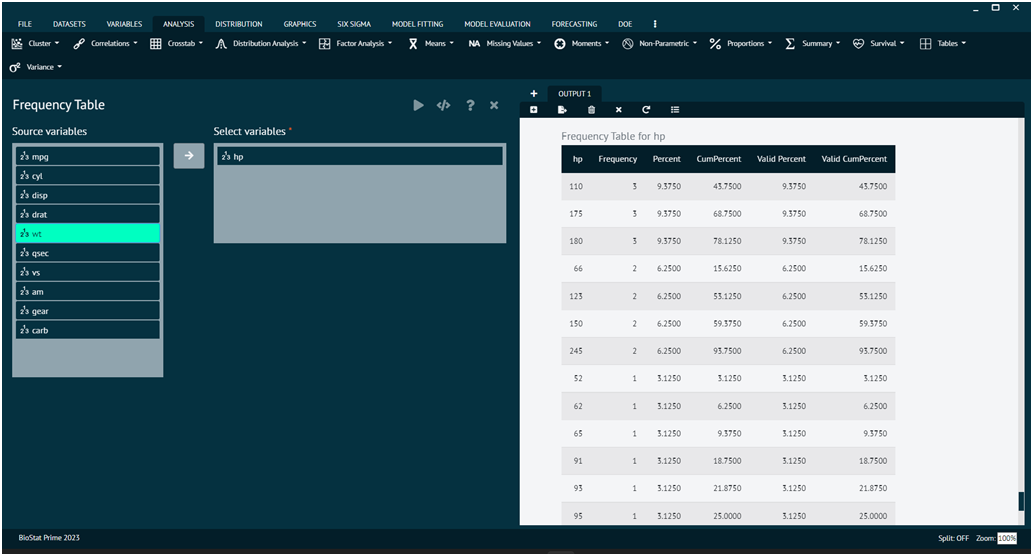
This section of summary tab gives user a chance to evaluate the frequencies of different variables of loaded dataset. The picture below shows the way user can choose required variables and execute the dialog to evaluate the frequency of selected variable.
Generates the frequencies for every unique value in one or more variables or column names selected.
