Cluster
In statistics, clustering is a technique used to group similar data points into clusters or groups based on certain criteria.
There are various clustering algorithms, each with its own approach to defining similarity and forming clusters.
BioStat Prime comes up with a platform to perform the algorithms to aid users in their analysis.
Hierarchical Clustering
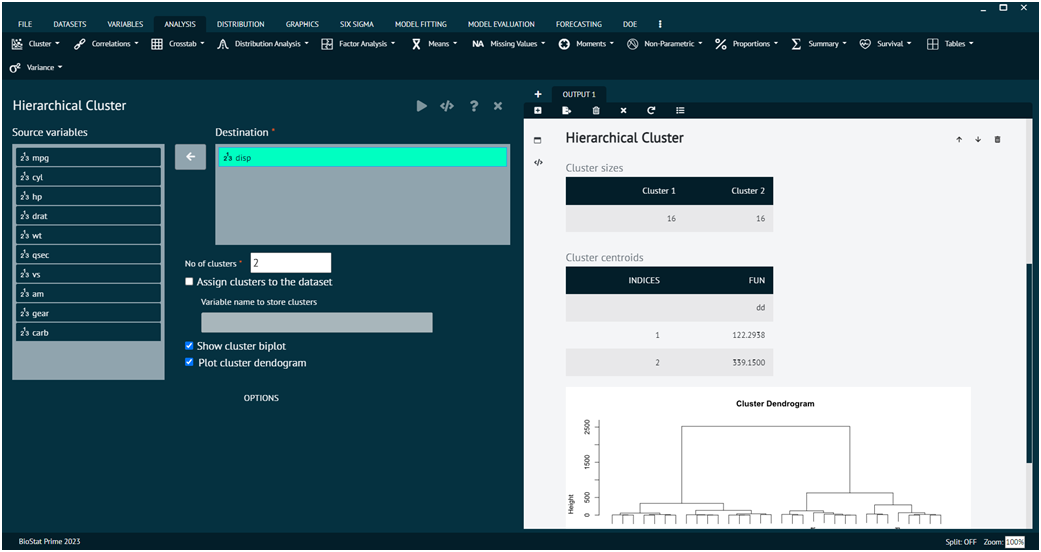
This sub menu provides Hierarchical cluster analysis on a set of dissimilarities and methods for analyzing it.
Hierarchical clustering builds a hierarchy of clusters, creating a tree-like structure (dendrogram) that shows the relationships between clusters at different levels.
To analyse it in BioStat Prime user must follow the steps as given.
- Steps
Load the dataset -> Click on the analysis tab in main menu -> Select CLUSTER button -> Select Hierarchical Cluster -> This leads to the analysis technique in the dialog -> Select the source variable -> Write no. of clusters values -> Execute the dialog.
The result of the analysis will be visible in the output. Users can also decide whether to assign cluster values to dataset, plot cluster dendrogram, show cluster bi plot.
The options tab at the bottom leads the user to further methods and metrics that the user can choose according to the requirements.

- Arguments
varsToCluster: The variables to analyze
method: the agglomeration method to be used. This should be (an unambiguous abbreviation of) one of "ward.D", "ward.D2", "single", "complete", "average" (= UPGMA), "mcquitty" (= WPGMA),"median" (= WPGMC) or "centroid" (= UPGMC).
noOfClusters: The number of clusters desired
plotDendogram: Plot a dendogram True or false
assignClusterToDataset: Save the cluster assignments to the dataset
label: name for the new variable that stores the cluster assignments
plotBiplot: plot Biplot TRUE or FALSE
K-Means Clustering
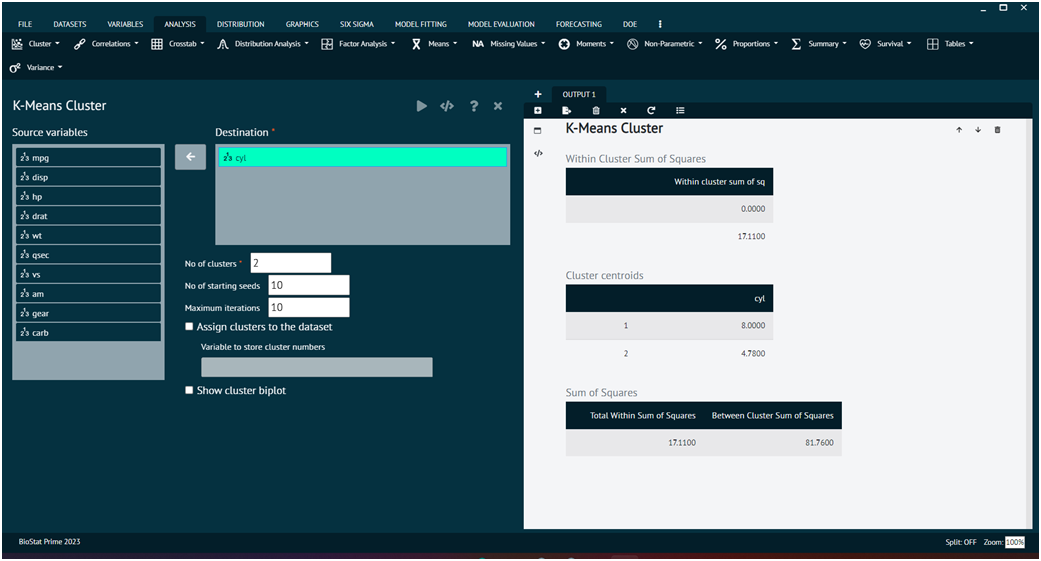
This sub menu performs K-means clustering.
K-Means is a popular partition clustering algorithm that aims to partition data into K clusters. It iteratively assigns data points to clusters and updates cluster centroids until convergence.
To analyse it in BioStat Prime user must follow the steps as given.
- Steps
Load the dataset -> Click on the analysis tab in main menu -> Select CLUSTER button -> Select K-Means Cluster -> This leads to the analysis technique in the dialog -> Select the source variable -> Write no. of clusters values -> Execute the dialog.
The result of the analysis will be visible in the output. User can also decide whether to assign cluster values to dataset, show cluster bi plot, no. of starting seeds, maximum iterations.

- Arguments
vars: The variables to analyze in a vector of form c('var1','var2'...)
centers :either the number of clusters, say k, or a set of initial (distinct) cluster centers. If a number, a random set of (distinct) rows in x is chosen as the initial centers.
iter.max: the maximum number of iterations allowed.
num.seeds: The number of different starting random seeds to use. Each random seed results in a different k-means solution.
storeClusterInDataset: Save the cluster assignments to the dataset
varNameForCluster: The variable names for the assigned clusters
dataset: The dataset to analyze