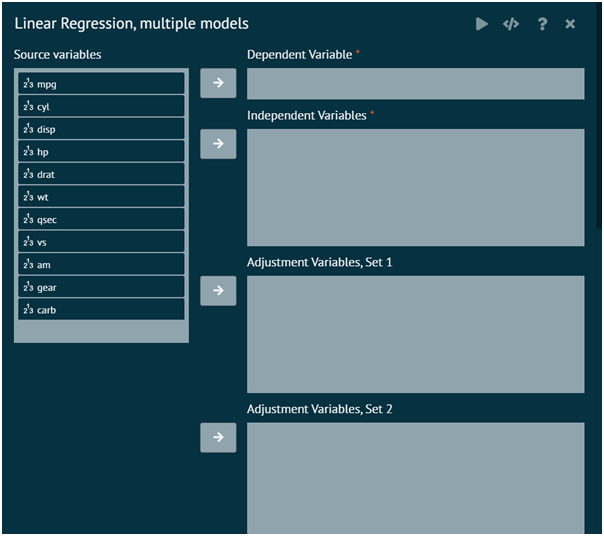
Linear Regression, multiple models
This creates a table containing results from linear regression models for a given dependent variable. Separate linear regression models will be fit for each independent variable, optionally adjusted for a set of additional variables. If a strata variable is specified, separate models will be fit for each of the stratification variable values.
As an example, if no adjustor or stratification variables are specified, then the table will include all univariate models for the list of independent variables. Various statistics from each model can be output.
To analyse it in BioStat Prime user must follow the steps as given.
- Steps
Load the dataset -> Click on the Model Fitting tab in main menu -> Select Regression -> This leads to analysis techniques, choose Linear Regression, multiple models -> There will appear a dialog -> Select dependent variables, independent variable and Adjustment Variables, Sets in the dialog -> Finally execute the plot and visualise the output in output window.

Attributes
- Dependent Variable
Dependent variable for each linear regression model. The variable class must be a numeric type.
- Independent Variables
Independent variables to include in the models. The variable classes can be a numeric type, character, factor, or ordered factor.
- Adjustment Variables (Sets 1-5)
Optional variables to be included in a model with the independent variables. The variable classes can be a numeric type, character, factor, or ordered factor. Specifying more than one set of adjustor variables will provide separate models with each set of adjustor variables.
- Strata
Optional stratification variable. Separate models will be fit for the subset defined by each of the stratification variable values. The variable class can be character, numeric, factor, or ordered factor.
- Weights
Optional case-weights to be used in the models. Specifying a weights variable will fit weighted regression models.
Digits After Decimal
- Continuous Values
The number of decimal places to show for all continuous values in the table (default=4)
- P-Values
The number of decimal places to show for all p-values in the table (default=4)
Options
Parameter Estimates
- Parameter Estimates
Show parameter estimates (coefficients) from each model.
- Standard Errors
Show standard errors of the parameter estimates.
- Confidence Interval Level
Level for the parameter estimate confidence intervals (default=0.95).
- Intercepts
Show the y-intercepts from each model.
- Adjustment Variables
Show model output for the adjustment variables.
- Standardized Estimates
Show standardized parameter estimates from each model. These are the parameter estimates corresponding to a standardized version of all continuous variables ((value - mean) / standard deviation).
- Confidence Intervals
Show confidence intervals for the parameter estimates.
- Adjustment Names
Show a column delineating model types (unadjusted and different adjustment variable sets). Mostly useful when you don't want to show model output for the adjustor variables.
Sample Size
- Sample Size
Show the sample size used from each model.
- Number Missing, if any
Show the number of observations not used in each model (missing values), only if there are some not used.
- Number Missing, always
Show the number of observations not used in each model (missing values), regardless of whether there are some observations not used.
Fit Statistics
- R-Squared
Show the model R-Squared value
- Adjusted R-Squared
Show the model adjusted R-Squared value
- Akaike Information Criterion (AIC)
Show the model Akaike Information Criterion
- Bayesian Information Criterion (BIC)
Show the model Bayesian Information Criterion
- Log-Likelihood
Show the model log-likelihood value
P-Values
- Parameter t-statistics
Show the p-values from the individual parameter t-tests
- Model F-test
Show the p-value from the overall model F-test
- Likelihood Ratio Tests (not adjustors)
Show the p-values for each independent variable based on a likelihood ratio test. This compares a model with the independent variable to a model without the independent variable, including any adjustor variables in both models.
Test Statistics
- Parameter t-statistics
Show the t-statistics from the individual parameter t-tests
- Model F-Test
Show the F statistic from the overall model F-test