Non-Linear Regression
Nonlinear regression is a statistical technique that uses a nonlinear function to model the relationship between a dependent variable and one or more independent variables.
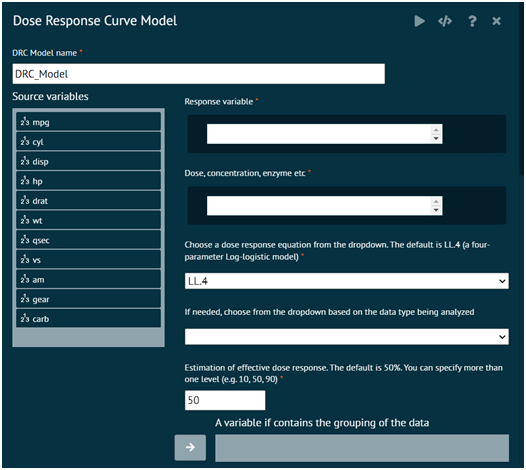
Dose Response Curve
Analysis of dose-response data through a suite of flexible and versatile model fitting and after-fitting analysis functions to estimate parameters with the various dose response equation function
To analyse it in BioStat Prime user must follow the steps as given.
- Steps
Load the dataset -> Click on the Model Fitting tab in main menu -> Select Non-Linear Regression -> This leads to analysis techniques, choose Dose Response Curve -> There will appear a dialog -> Select the NLS Model name, Response(dependent) variables, Dose, concentration, enzyme etc, in the dialog -> Fill in the other options. -> Finally execute the plot and visualise the output in output window.

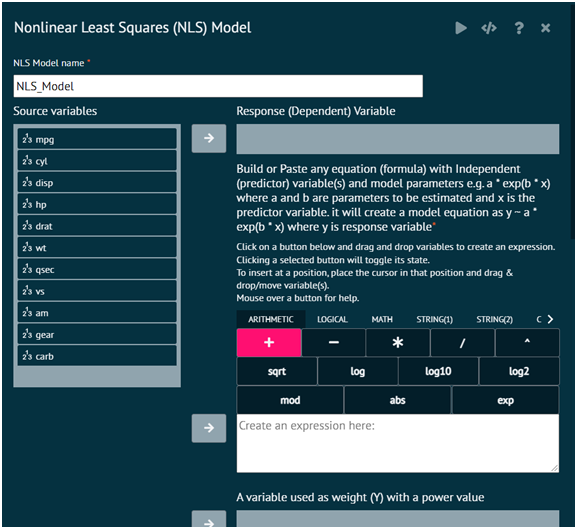
Non-Linear Least Square(NLS) Model
This function performs nonlinear regression. Build or type in any equation (formula) to build the nonlinear regression model. Determine the nonlinear (weighted) least-squares estimates of the parameters of the nonlinear model. Analyze model fit with graphs.
To analyse it in BioStat Prime user must follow the steps as given.
- Steps
Load the dataset -> Click on the Model Fitting tab in main menu -> Select Non-Linear Regression -> This leads to analysis techniques, choose Non-Linear Least Square(NLS) Model -> There will appear a dialog -> Select the DRC model name, Response variables in the dialog -> Fill in the other options. -> Finally execute the plot and visualise the output in output window.

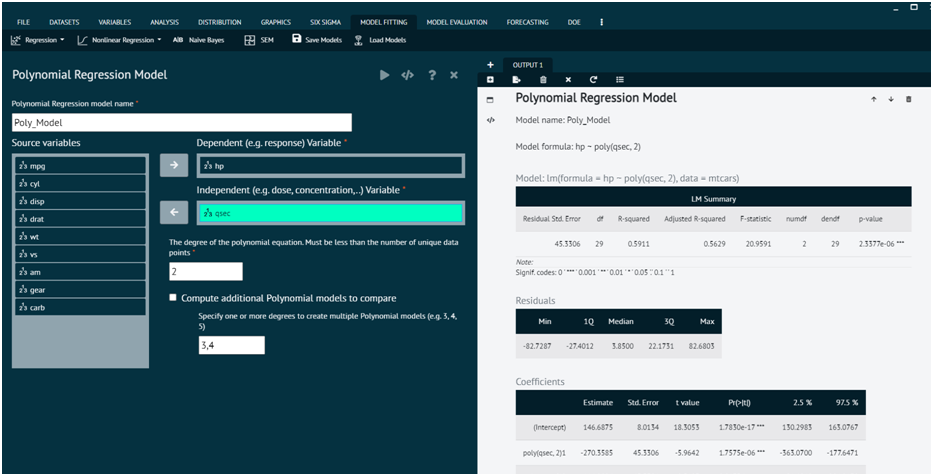
Polynomial Regression Model
This dialog is used to compute and fit an orthogonal polynomial model with specified degree
To analyse it in BioStat Prime user must follow the steps as given.
- Steps
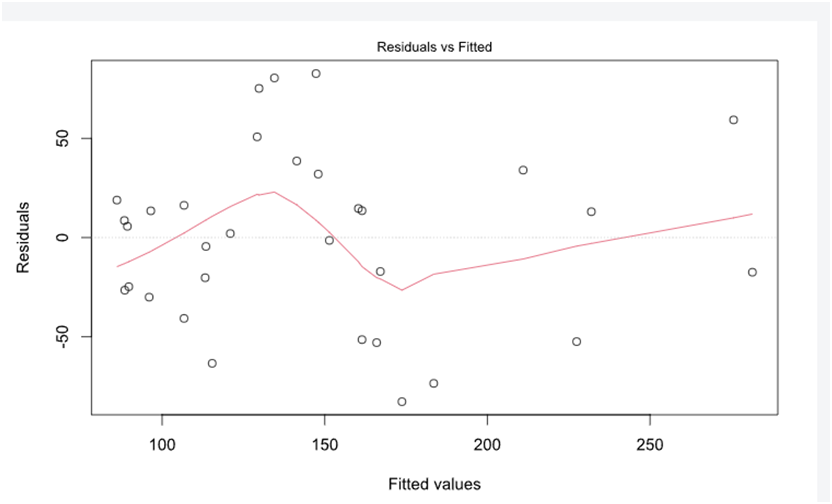
Load the dataset -> Click on the Model Fitting tab in main menu -> Select Non-Linear Regression -> This leads to analysis techniques, choose Polynomial Regression Model -> There will appear a dialog -> Select the Polynomial Regression model name, Dependent (e.g. response) Variable, Independent (e.g. dose, concentration,..) Variable, The degree of the polynomial equation in the dialog -> Fill in the other options. -> Finally execute the plot and visualise the output in output window.

