Scatter plots
For representing any dataset in terms of Scatter Plot.
- Steps
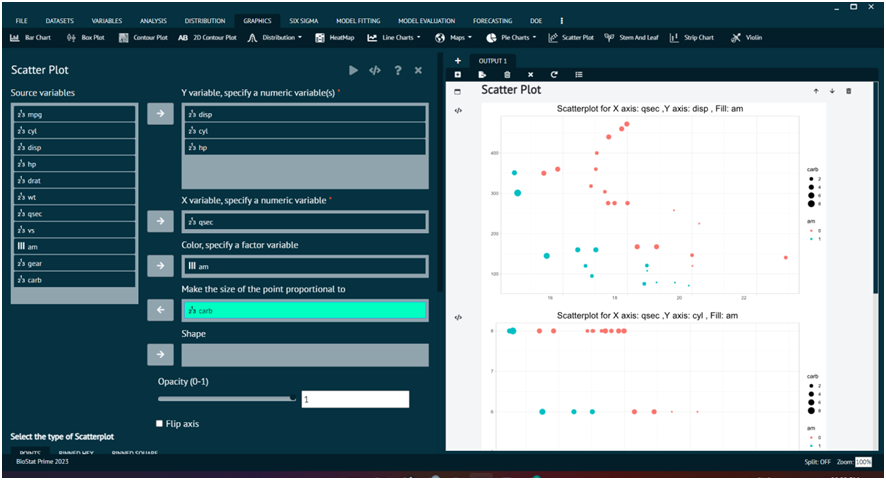
Load the dataset that needs to be visualized -> Go to Graphics -> Scatter Plots -> Put in the values for variables -> Execute the dialog.
The output of the Scatter Plot of a sample dataset can be seen in the picture below.

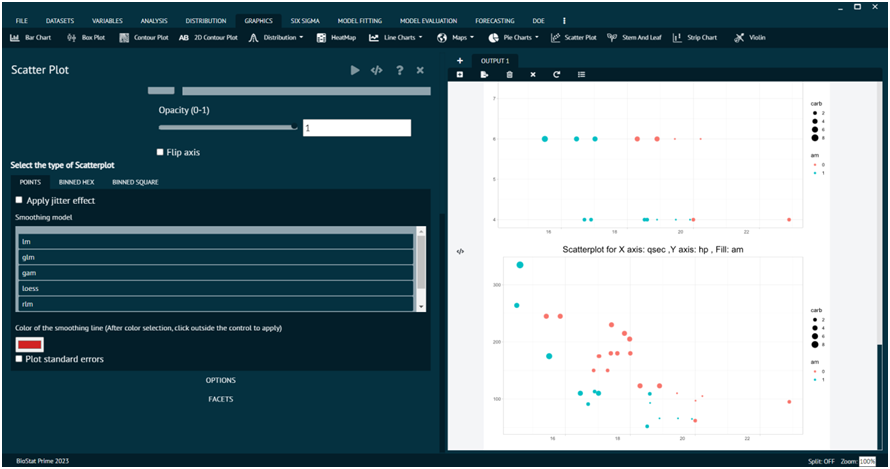
The Select type of Scatter plot tab at the bottom can be utilized to add more features to the output as shown below.

Last modified: 22 December 2025