Crosstab
In statistics, a crosstab, short for "cross-tabulation" is a table that displays the relationships between two or more categorical variables. It provides a summary of the distribution of one variable in relation to another.
Crosstabs are particularly useful for analyzing and visualizing the association or dependency between categorical variables. Crosstabs are used when both variables under consideration are categorical. Categorical variables have distinct categories or groups with no inherent order.
The chi-square test of independence is often used in conjunction with crosstabs to determine whether there is a statistically significant association between the variables. This test assesses whether the observed frequencies in the cells are significantly different from what would be expected if the variables were independent.
BioStat Prime lays out 3 options in its Crosstab tab, i.e.
Crosstab
The main purpose of a crosstab is to show the frequency distribution of one variable across the levels of another variable.
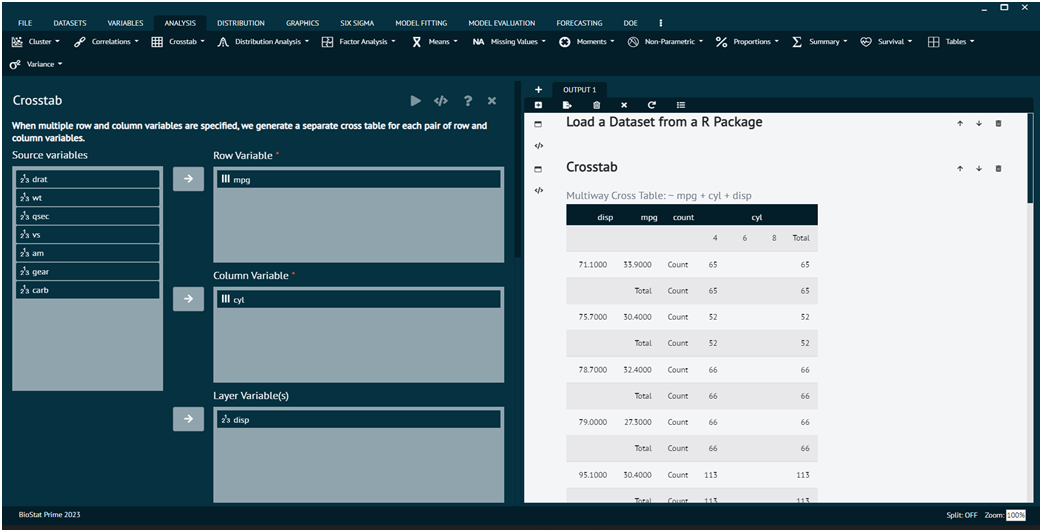
This sub menu creates crosstab with row, column and layer variables. When multiple row and column variables are specified, BioStat Prime generates a separate cross table for each pair of row and column variables.
To analyse it in BioStat Prime user must follow the steps as given.
- Steps
Load the dataset -> Click on the analysis tab in main menu -> Select Crosstab -> TheCrosstab contains 3 options, select the first one namely crosstab -> This leads to the crosstab analysis technique in the dialog -> Select the row and column variables -> Execute the dialog.

The result of the analysis will be visible in the output.
Crosstab List
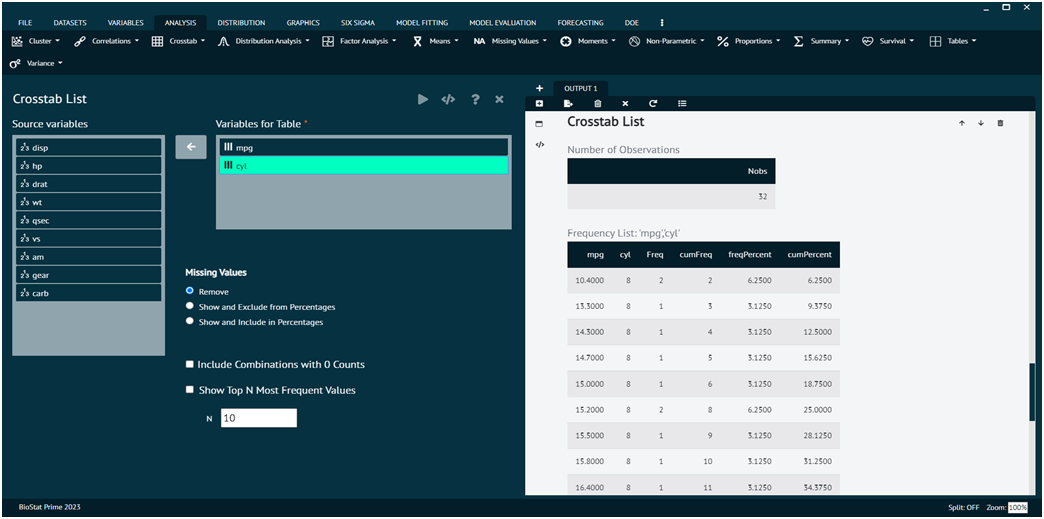
This sub menu creates frequency tables in a list format for combinations of one or more variables. Every combination of values across all specified variables will be tabled, with their observed frequencies. The specified variables can be any class, including numeric, continuous variables.
While this can be used for summary frequencies and percentages, a major use is checking data for inconsistencies.
In addition to raw counts, crosstabs often include percentages. These can be row percentages (percentage within each row) or column percentages (percentage within each column).
To analyse it in BioStat Prime user must follow the steps as given.
- Steps
Load the dataset -> click on the analysis tab in main menu -> Select Crosstab -> The Crosstab contains 3 options, select the second one namely crosstab list -> This leads to the crosstablist analysis technique in the dialog -> Select variables for the table -> Execute the dialog.

User can also opt for other options at the bottom related to frequencies, include combinations with 0 counts, show top N most frequent values.
The arguments used is executing the dialog are given as follows.
- Variables for Table
Variables to be included in the table, which can be any class. The table will be sorted according to the order of variables in this list. This means if variables A and B are the specified order, then the table will be sorted by levels of A, then levels of B within A.
- Missing Values
Remove: Variable value combinations that have NA's will be excluded from the table.
Show and Exclude from Percentages: Variable value combinations that have NA's will be included in the table, but will not be included in percentage computations.
Show and Include in Percentages: Variable value combinations that have NA's will be included in the table and be included in percentage computations.- Include Combinations with 0 Counts
Whether to include variable value combinations that don't exist in the dataset. For example, if variables A and B both have observed values of 1, 2, and 3, but (A, B) combination (1, 3) isn't observed in the data, this option would include a row for the (1, 3) combination with a frequency of 0.
- Show Top N Most Frequent Values
If checked, this would create a separate table with the top N most frequent variable combinations.
N: How many variable combinations to show for the top N table.
Odds Ratio/ Relative Risks, M by 2 Table
When working with a crosstab (contingency table) that involves categorical variables, measures such as odds ratios, relative risks, and the chi-square test (often referred to as the "chi-square test of independence") are commonly used to assess associations between variables.

To analyze all three of them in BioStat Prime user must follow the steps as given.
- Steps
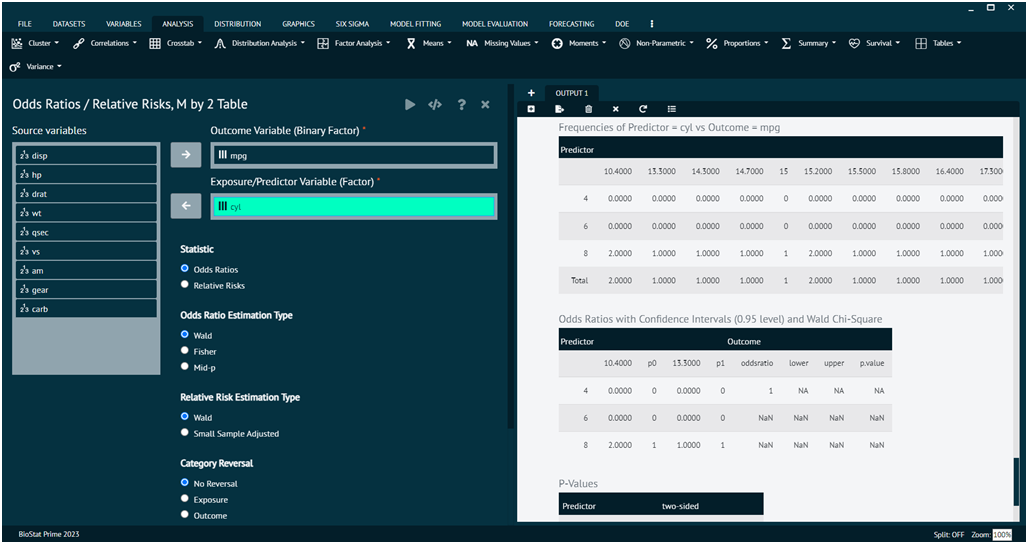
Load the dataset -> Click on the analysis tab in main menu -> Select Crosstab -> TheCrosstab contains 3 options, select the third one namely Odds Ratio/ Relative Risks, M by 2 Table -> This leads to the crosstablist analysis technique in the dialog -> Select variables for the table -> Execute the dialog.
This Sub menu is used to compare probabilities of having a "disease" for one group relative to another, in a ratio of odds (odds ratio) form or probability ratio (relative risk) form.
The arguments used is executing the dialog are given as follows.
- Outcome Variable
Binary "disease" (yes/no) variable of interest. By default, the highest category in the sort order is defined as "disease yes".
- Exposure/Predictor Variable
Groups to compare. Can have more than 2 groups.
- Statistic
Which statistic to compute
- Odds Ratio / Relative Risk Estimation Type
Wald (unconditional maximum likelihood), Fisher (conditional maximum likelihood), Mid-p (median unbiased method), or Small Sample Adjusted